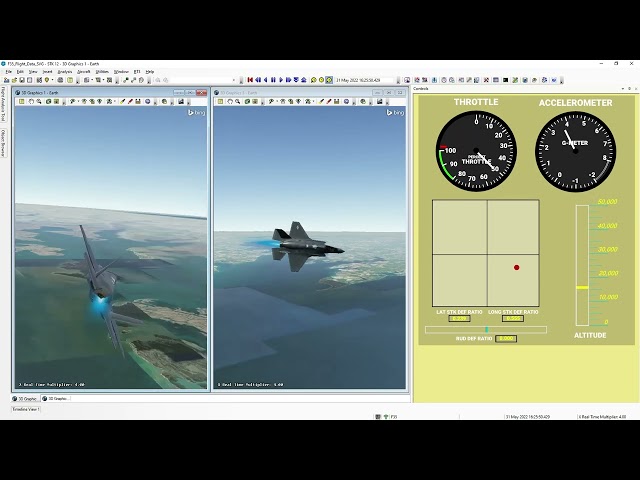
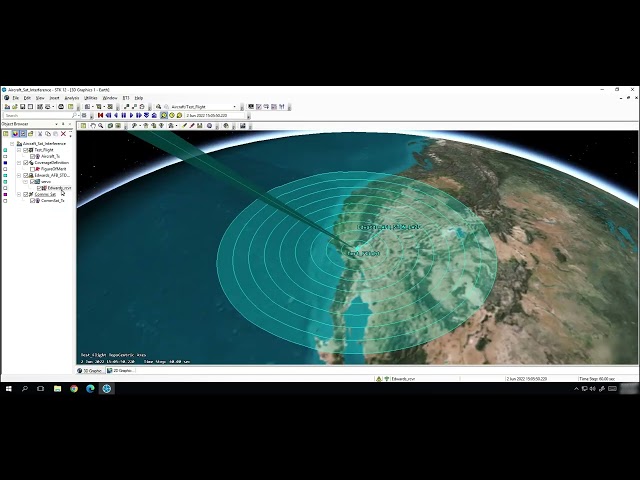
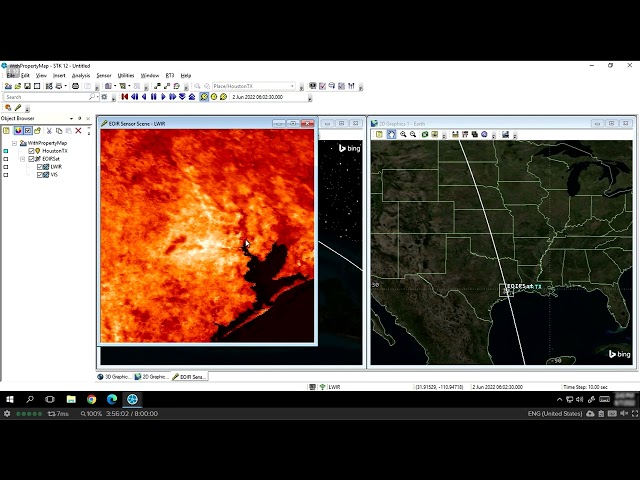
Dynamic link performance analysis and modeling
STK/Communications lets users quickly identify when their link will meet the desired performance criteria. All
typical link parameters may be analyzed, including frequency, RIP, C/N, C/No, Eb/No, and Bit Error Rate. Users
can choose the level of detail they want in the communications system being modeled—ranging from simple models
like isotropic transmitters and receivers to complex antenna patterns and system-temperature modeling.
STK/Communications antenna types include Gaussian, parabolic, square horn, non-uniform aperture, dipole, helix,
hemispherical, GPS global beam, and multi-beam; custom types such as ITU standards; importable types from ITU
GIMROC database and Intelsat; and user-defined types from external files. These transmitter and receiver
types—coupled with nearly all standard modulation schemes, polarization types, system noise temperatures
(line loss, line temperature, antenna noise), spread-spectrum modeling, RF environment modeling (space loss,
rain rate, gaseous absorbtion), auto-track frequency, auto-scale bandwidth, and user-defined inputs such as
transfer functions, pre-receive gains, pre-demod gains, and post-transmit gains—provide unparalled flexibility
for defining communications systems and performing analysis on various aspects of the system.
RF environment modeling
STK/Communications provides a full range of environment models, including the following empirical rain models:
Crane 1982, Crane 1985, CCIR 1983, and ITU-R P.618. Gaseous absorption effects are also calculated via
user-defineable water vapor content and temperature. For further flexibility, the empirical rain models can be
overridden with user-defineable outage percentage and rain rate.
Contours
Custom-defined contour levels (gain, EIRP, RIP, and flux density) allow users to quickly visualize their
antenna pattern coverage and power levels to quickly determine whether they will have the necessary link
performance over the area of interest. The contours may be visualized on any 2-D projection in STK and any
color-coded gain volume in AGI's 3D environment. Contours may be exported as GIS compatible shapefiles to
facilitate market analysis. Using a commercial GIS software package, such as Esri's ArcView GIS, contours
may be queried against geographically referenced datasets including population densities, consumer preferences,
environmental conditions, and more.
Multi-beam antenna modeling
Multi-beam transmitter and receiver models require multi-beam antennas in
communications link analysis. Within STK/Communications, each beam may be setup as an independent antenna by
specifying its frequency, RF power level, polarization state, gain and characteristic type. Each beam's
boresight directions can also be oriented independently. STK/Communications can take your analysis one step
further by calculating and displaying aggregate contours for multi-beam antennas in 2D and 3D. The detailed
coverage contour may also be seen on the 2-D map, while the 3-D beam shapes and coverage are projected onto
the globe. Different beam selection criteria, such as "maximum gain" toward a receiver or "minimum boresight
angle" in the direction of a communications link, can be employed to help model varying operational strategies.
Interference analysis
STK/Communications performs network and target interfence analysis as well as
target interference analysis. For network interference analysis, it enables users to define a communications
system and a "network" of potential interferers. The software then quickly calculates the impact of the
interference network into communication links and presents the results as time-ordered data and statistical
summaries using probability density functions (PDFs) and cumulative density functions (CDFs), and also
highlights the interferers during the STK animation period on both the 2-D projection and 3-D globe.
Paired with the STK/Coverage or STK/Attitude module, STK/Communications can display jamming/interference
contours on 3-D Coverage grids or on the 3-D Attitude sphere. Users can also investigate the C/(N+I), C/I,
DT/T, and power flux density.
Interference analysis for a specific link (e.g., ground station to a target) can be accomplished quickly by
leveraging STK's Satellite Database, which contains more than 10,000 NORAD tracked and cataloged orbiting
objects. Combined with a user-supplied RFI database file characterizing the transmit and receiver threshold
for the satellites of interest, STK/Communications can quickly identify which satellite may cause or be
susceptible to RF interference from a ground station.
Integration with other modules
STK/Communications leverages benefits of other modules in the STK
suite, enabling users to maximize their analytical and visualization power. For example, use STK/Communications with:
- STK/Coverage to generate statistics on cumulative link performance across a geographical region or analyze the effect of link availability on navigation quality
- STK/Attitude to compute and display jamming or interference analysis on an attitude grid
- Urban Propagation Extension provides very fast site-specific path loss predictions for communication links in urban environments with attributes that make it the ideal choice for defense and intelligence applications involving trade studies, time-based scenarios and coverage analyses.
Custom inputs
To ensure a user's analysis can reflect the latest and best information available, STK
includes a customizable database of RF payloads, propagation and environmental models. Simple ASCII files can
be used to input custom antenna data, modulation schemes and transfer functions for use in the link analysis.
Furthermore, plugin points in STK/Communications let you integrate your own custom-scripted functions, as well
as create your own definitions for receivers, transmitters, antennas and constraints quickly and easily using
AGI-provided script templates.
Interoperability with QualNet
STK/Communications includes off-the-shelf interoperability with QualNet, an industry-recognized network modeling and simulation tool. Controlled from the STK GUI, the QualNet Interface combines network performance evaluation from QualNet with the platform mobility models, wireless link calculations and mission visualization environment of STK, making it easier to establish a realistic mission scenario, improve the fidelity of physical layer calculations, and help illustrate how network performance impacts the mission.
Learn more.