Recently we here at AGI just received our first commercial Space Situational Awareness (SSA) contract and our command center is now up and running. We’ve been collecting our own data on objects in orbit for about a year now and it’s great to finally have our first customer, but SSA is a bit of a buzz word. So being the resident AGI electro-optical and infrared (EOIR) imaging guy I’ve been involved in a bit of the initial setup and I wanted to briefly talk about what SSA actually is, at least in my context.
I’m an image scientist, so from my perspective and most other image oriented folks I look at data that is upstream from a lot of the derived products and results. I like to see and process pictures, the raw data coming off of the sensors, and the satellites in these images are just faint little dots at best. This handfull of pixels are passed to an automated detection algorithm that turns them into precise locations called observations. These observations are then fed into the orbit determination and space object characterization algorithms, which finally lead to some type of actionable intelligence or catalog update to provide Space Situational Awareness, answering questions like:
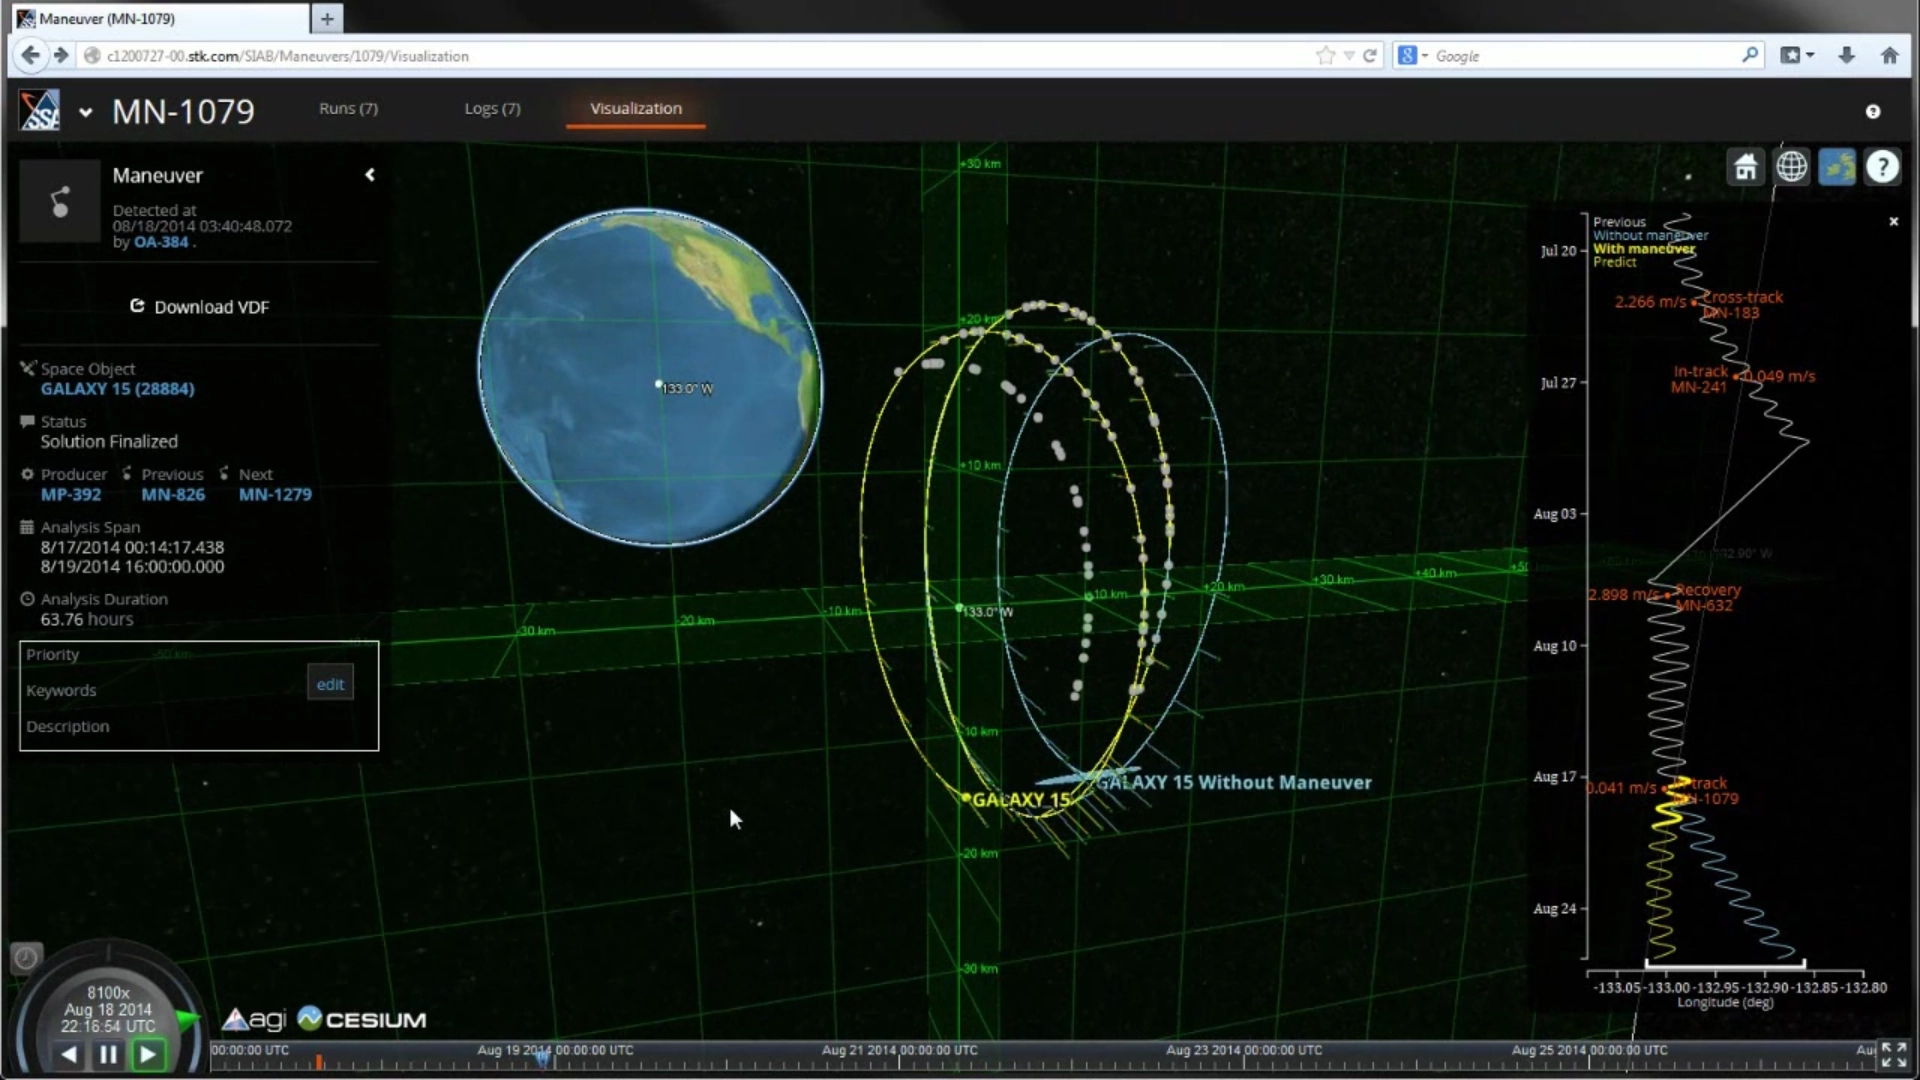
- Is my satellite where it's supposed to be?
- Did my satellite maneuver change my orbit as I expected it would?
- Is there anybody else in my designated orbital neighborhood?
- Does my satellite's baseline signature still look the same?
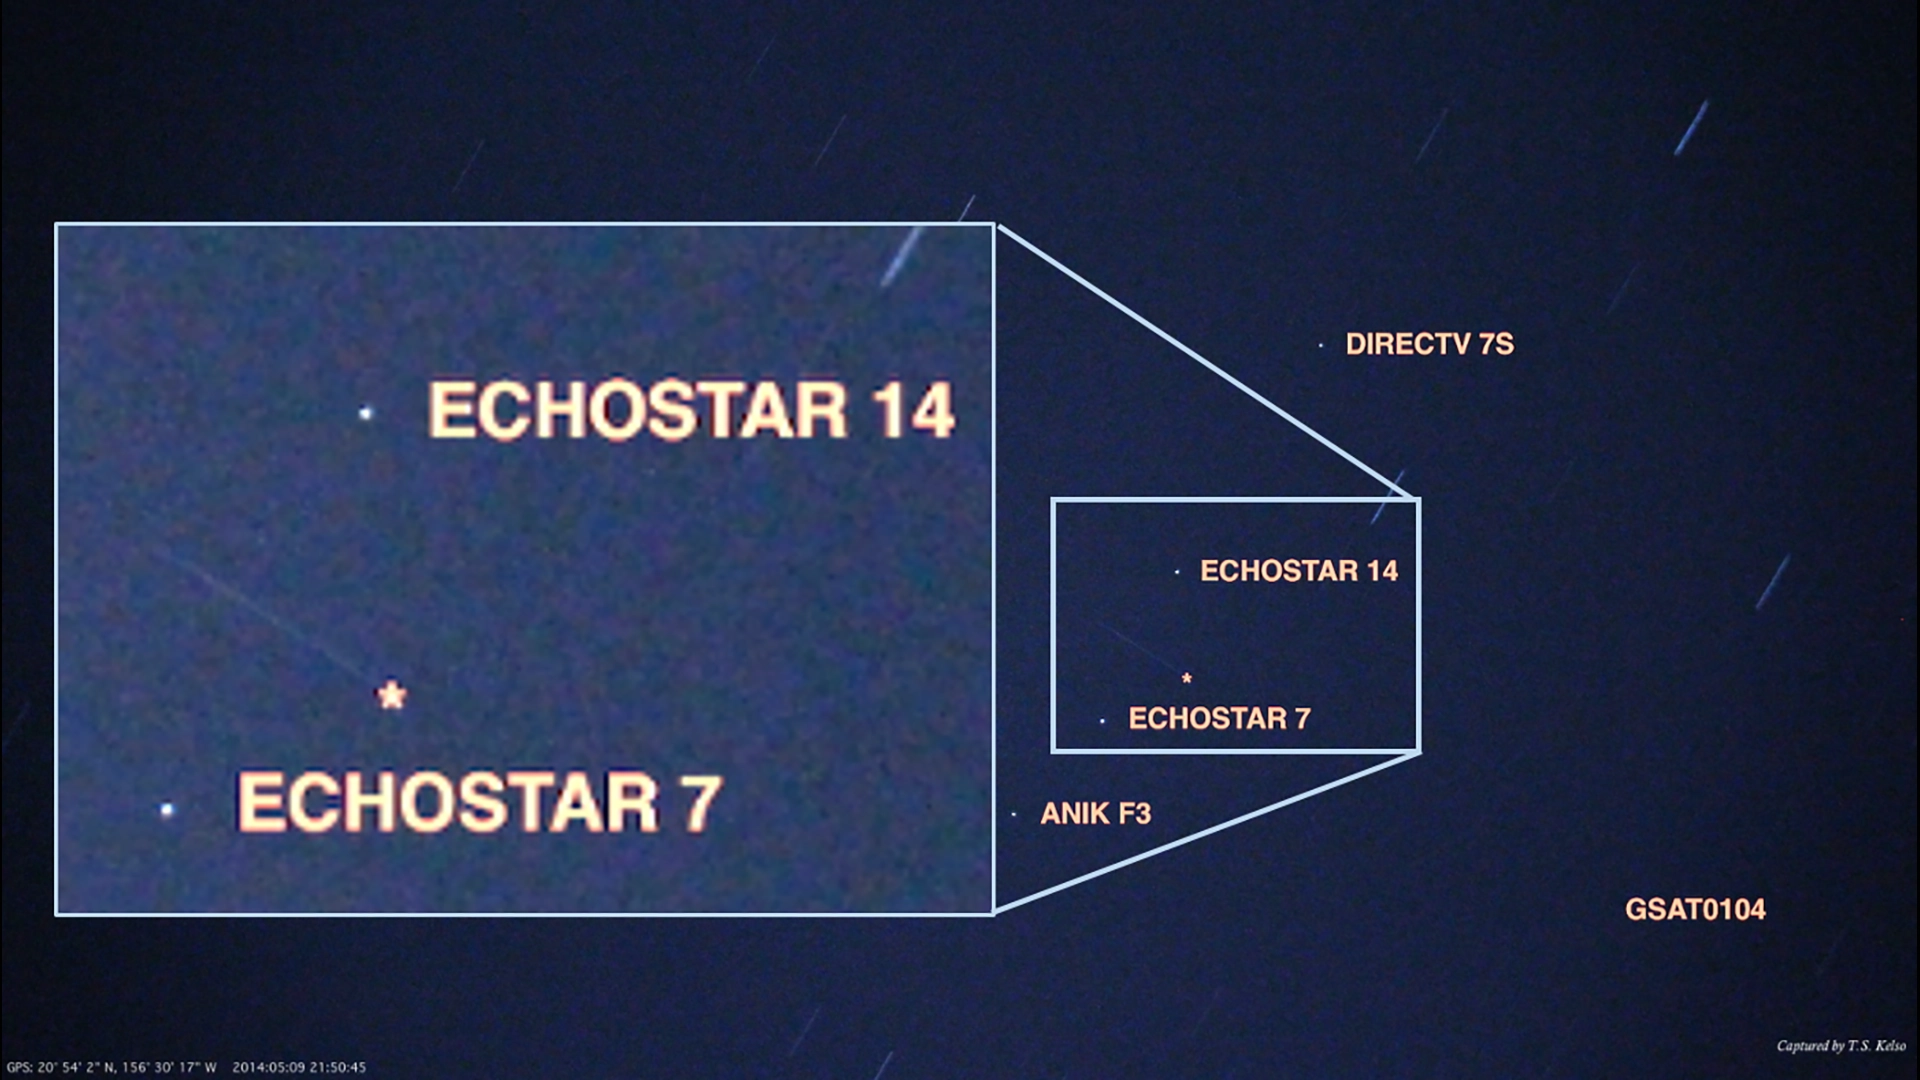
If you take a look at the first 30 seconds of this
video or the image below you will see an example of what raw SSA data actually looks like. These pictures were taken from the ground by our own scientist Dr. T.S. Kelso with a regular digital camera of 4 satellites all the way out in geostationary orbit. We also see a 5
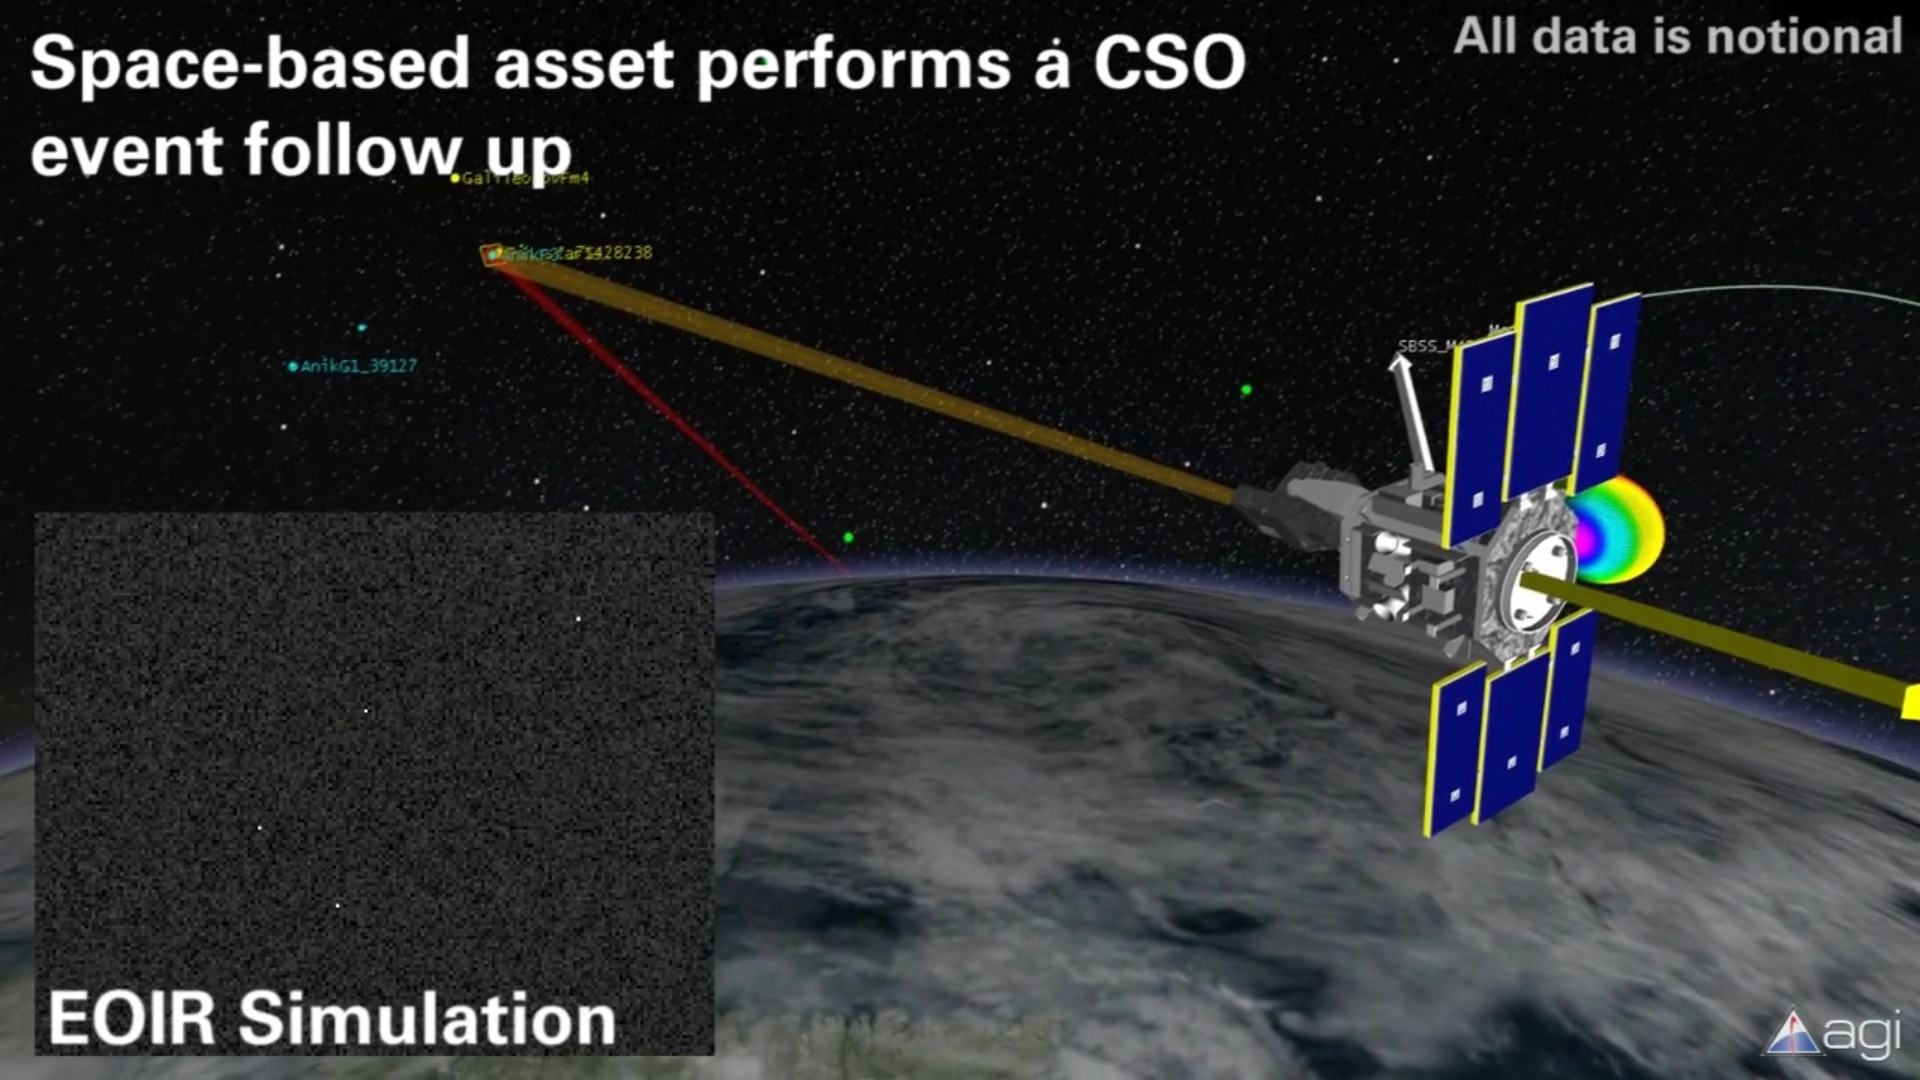
th satellite that appears to pass between them. As a validation test we also created a matching
STK/EOIR simulation, which is the tool I work on.
There’s not much in these images:
- Four dots - These are the satellites
- Lots of streaks - These are the stars
- One odd streak moving in a different direction from the stars - This is the 5th satellite in a different orbit
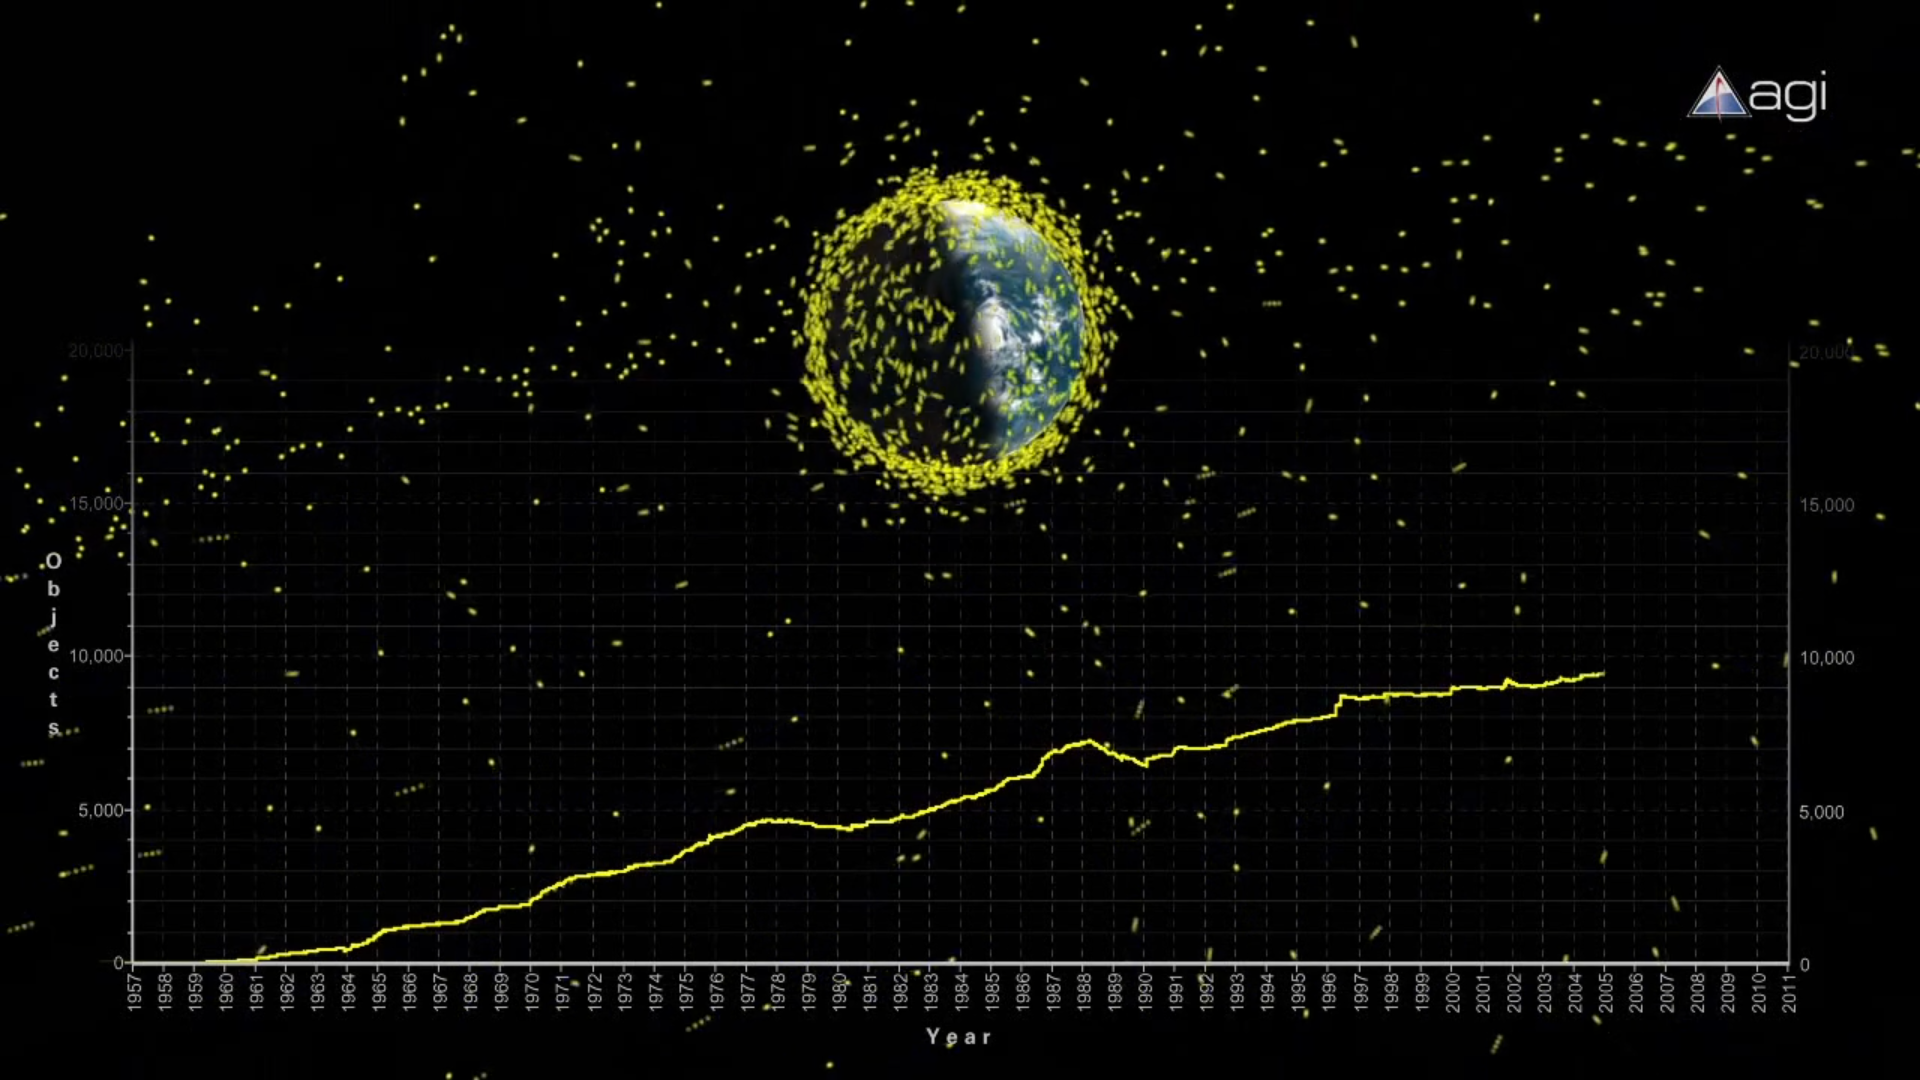
The reason all the stars are streaked out is because we’re using longer image exposure times to maximize the faint signal of these objects that are really far away. Even with these images though all we get are a few dots, and if you zoom way in on any of those dots the most we can hope for is a blob of bright pixels to work with. However with enough of these dots or blobs collected over time you can map out a satellite's trajectory, roughly figure out its orbit, and perform some characterization based on the relative amount of reflected light. However there are two halves to SSA: knowing where your own satellites are in space but also knowing what else is around you. How much stuff is out there? You check out this
AGI video to see some of our visualizations of all the satellites in orbit as well as a depiction of what debris from a collision would look like. There's also a plot from this video below showing the number of objects in orbit over time.
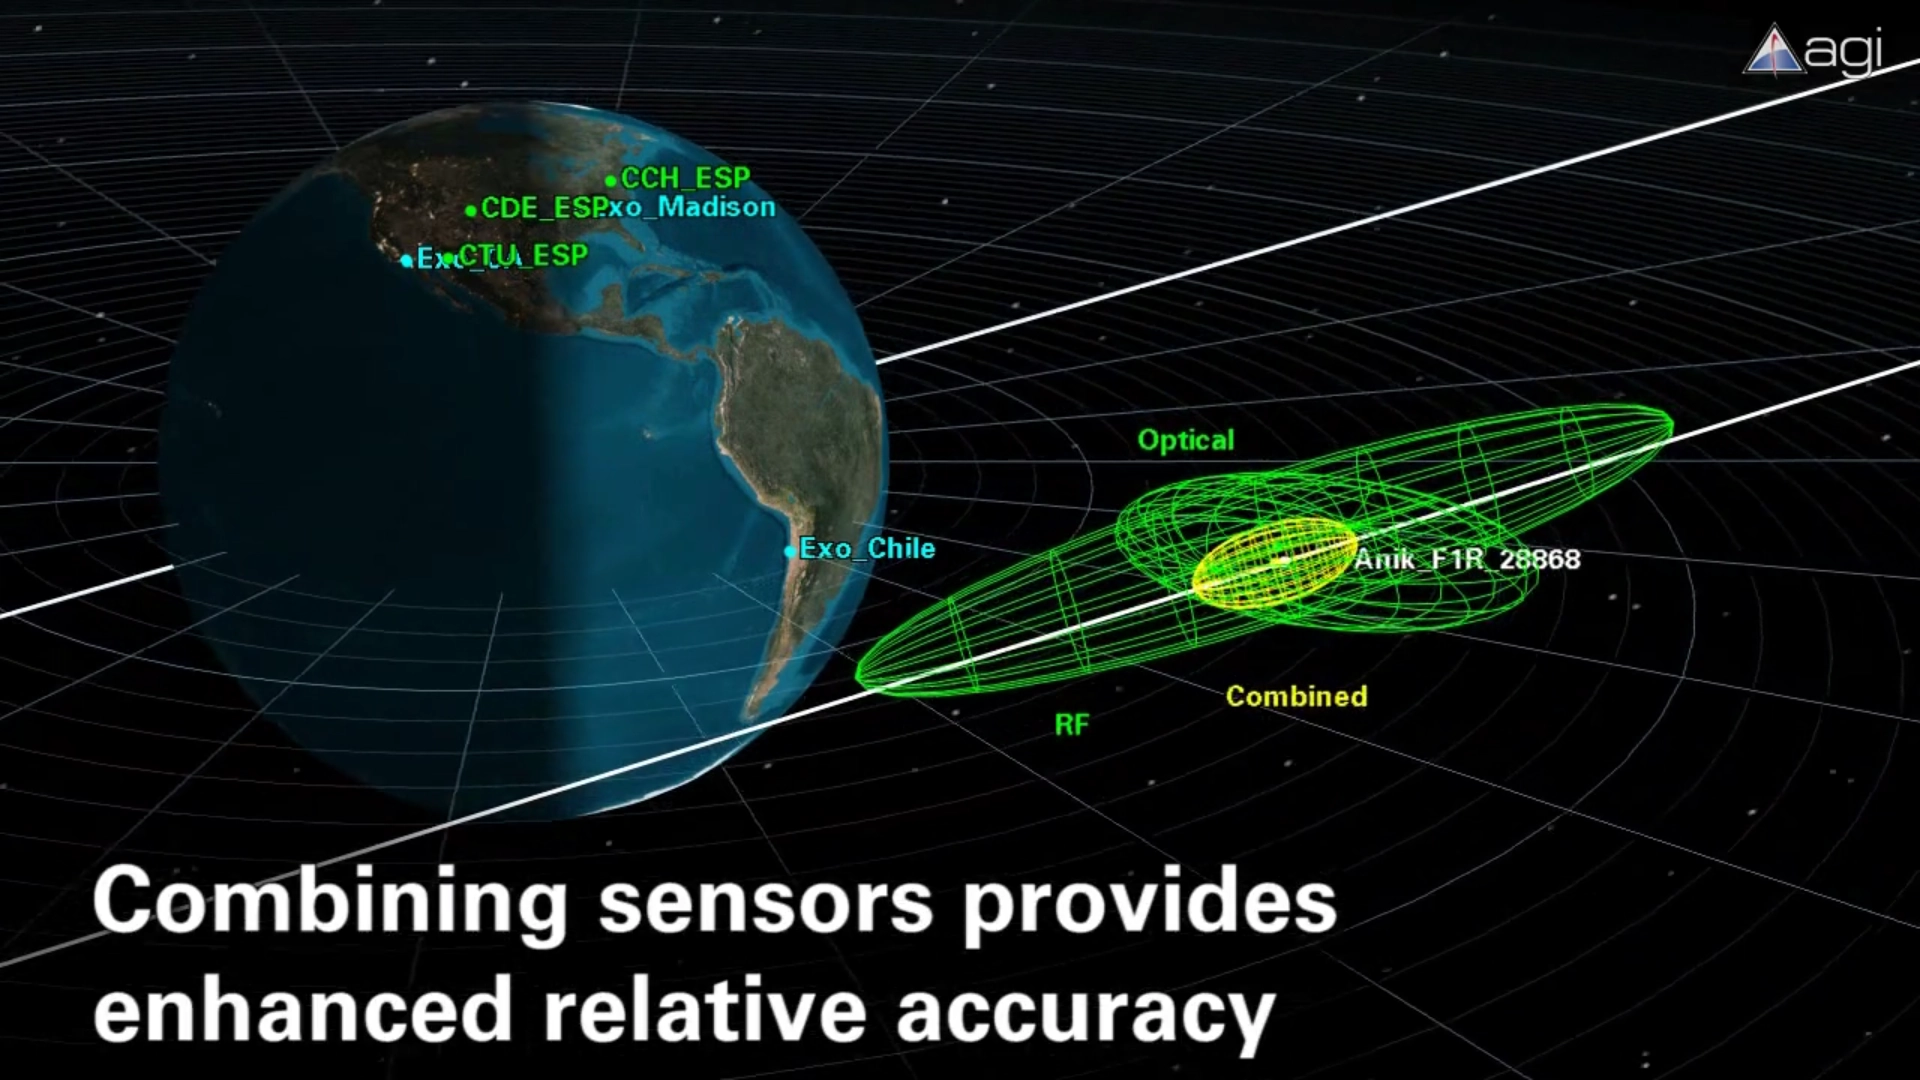
Normally you get SSA data from a number of different sources, from onboard ephemeris and attitude measurements taken by the satellites themselves and transmitted down, to pictures or RADAR images taken from the ground, or even communications triangulation methods. This is something that governments and satellite owner operators do collect but it can be expensive and not all data is shared between private commercial satellites or other government agencies. AGI has been able to collect all these types of data ourselves on a pretty tight budget by automating as much of this process as we can and doing plenty of analysis to figure out how to best combine these multiple types of data or phenomenologies to provide the best quality and most cost effective solutions,. In fact that's the topic of a white paper written up by Dan Oltrogge from AGI, Mike Nicolls from SRI, and myself. Each of these phenomenologies has their own pros and cons, and COMSPOC is working with Boeing to combine all of these streams of data into very high quality orbits for their satellites as well as the other satellites in the neighborhood around them.
This is just the tip of the iceberg though. There’s a lot more that can be done with this data, from determining the efficacy of maneuvers, to warning of potential collisions, and even further characterizing the satellites themselves. Thanks and I hope this was helpful and interesting…
Pat North, AGI Imaging Scientist and Software Engineer
 EOIR
EOIR