Differences between 2D and 3D Graphics properties
- Dec 9, 2019
- Tech Tip
-
 Systems Tool Kit (STK)
In 1989, AGI was founded, but 3D modeling wasn’t introduced in STK until 1993! Because 2D graphics came first, a lot of the functionality from 2D graphics was shared or inherited by the 3D graphics. Still today, if you want to update some functionality of the 3D graphics page, you need to change the 2D graphics page. If you have ever been befuddled by the differences in the 2D graphics and 3D graphics properties for Attributes, Pass, or Contours, this blog should help alleviate the confusion.
Attributes properties
Some of the most important properties for visualizing an orbit are color, line style, and line width. All three of these properties are necessary for visualizing an orbit in 3D graphics. These three properties can be changed for both 2D graphics and 3D graphics under Attributes on the 2D graphics properties page.
The reason the attributes are listed under 2D graphics is because 2D graphics came first and became an inherited property of 3D graphics when it became popular.
Pass properties
Pass properties, which define the ground track and orbit path, can be confusing because they are listed under both 2D graphics and 3D graphics. If that was not clear, there is also an Inherit from 2D Graphics option. I will will cover the differences between 2D graphics and 3D graphics Pass properties as well as the Inherit from 2D graphics option.
2D Graphics
Two of the most important properties under Pass are the ability to change the number of ground tracks and amount of ground track shown. You can show the number of ground tracks that should be visible by selecting Show All or Show Pass From/To and show sections of the ground track by using Leading/Trailing.
For example, if you just want to show the first two orbits above the equator you can use the Show Pass From/To to choose two orbits and then Leading/Trailing to edit the orbit so that only the orbit that is above the equatorial line shows.
For a similar example, if you only want the ascending orbit above the equator to show, you could choose ascending under Visible Sides. You can even add labels to define the pass or path by checking Show Pass Labels or Show Path Labels.
Inherit from 2D Graphics
If the Inherit from 2D graphics checkbox is checked, the 2D graphics and 3D graphics will share the same Pass properties. This is unlike the Attributes tab because the 2D and 3D graphics automatically share the properties set.

3D Graphics
If the Inherit from 2D graphics checkbox is not selected, the Pass is defined by the 3D graphics Pass page.
The Leading/Trailing Ground Track and Orbit Track are the same for the 2D graphics page and 3D graphics page, but if it is not inherited from the 2D graphics page it should be defined on the 3D graphics page.
The 3D graphics page has an option for tick marks that is not available in the 2D graphics tab. This is useful because the tick marks can be spaced at even intervals of distance to show how far the object has gone through time. In the same example, if you would like to show a tick every 50 kilometers for two ascending orbits above the equator the orbit or ground track could be selected and the tick width could be set to 50 km.
Contours and Range Contours
Contours, which are like circles with points that are at a certain distance from an object, can be defined in the 2D graphics properties and are shared by the 3D graphics properties. This is similar to the Attributes properties because both the 2D graphics and the 3D graphics use what is set in 2D graphics. The contours are different than the attributes properties because there are more options available in 3D graphics.
2D Graphics
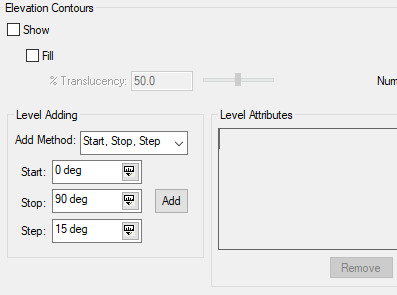
You must set 2D graphics properties if contours are needed for 3D graphics properties.
The way to add a contour for either range or elevation is by adding levels. Levels must be added in the Level Adding. The methods to add a level are either Start, Stop, Step of Explicit. These can be defined in Add Method. After levels have been added, if an Elevation or Range Contour should be displayed check the Show checkbox. If the contour is too dark the translucency can be set lower.
3D Graphics
3D graphics properties inherit what is set in 2D graphics properties and will not show without the levels being added in 2D graphics. The main differences for the 3D graphics for elevation contour is the ability to show the South Atlantic Anomaly Contour and the Covariance Pointing Contour. These three options are defined below.
The South Atlantic Anomaly Contour is used for satellites only and will only show if the object is a satellite.
The Covariance Pointing Contour defines the direction of uncertainty contours from the object.
The Range Contour is different than the 2D Graphics because it also has an option for showing the boundary. This option allows for the boundary wall to be seen as well as the upper and lower edge.
Author

Systems Tool Kit (STK)
Modeling and simulation software for digital mission engineering and systems analysis.