Testing Automation using Python in Anaconda
- Nov 4, 2019
- Article
-
 STK Components
First released in 1991, Python is an interpreted, object-oriented programming language. Over the years, the user community expanded it quite a lot and developed a number of libraries (aka modules) useful for plotting, scientific computation, data structure analysis, etc.
Today, Python is one of the most popular programming automation languages because it is an excellent choice for scripting and rapid application development. In this framework, you can easily automate STK calculations and data retrieval, which you can use for post processing analysis.
To test the automation capability using Python, I simply installed Anaconda. Anaconda is a free and open-source distribution of the Python programming languages for scientific computing (data science, machine learning applications, large-scale data processing, predictive analytics, etc.), that aims to simplify package management and deployment. Among other features, Anaconda also supports JupyterLab, an interactive environment that runs on a browser’s page and defines a live document (called Jupyter notebook) where you can collect and manage data.
You can also use Anaconda directly inside STK (take a look at this blog).
Since Python is an object-oriented language, all the properties and the methods in the AGI APIs are available as soon as the root object is declared and initialized. The connection with STK happens via the COM layer (like in MATLAB, for example) but the syntax is a little different.
The example described here deals with the access analysis between a ground station and a LEO satellite. All the objects (including the scenario) are created at runtime and the calculation’s results are reported back to the script, where data is manipulated in such a way that we can analyze it in the most efficient way.
An interesting characteristic of the Jupyter environment is that the source code can be divided into small blocks (cells) where you can logically organize functionalities. In the figure below, you can see how the code is organized in my notebook:- Cell 1 establishes a COM connection with STK and takes the root object.
- Cell 2 creates a new STK scenario.
- Cell 3 defines the scenario object and changes the start/stop times.
- Cell 4 creates a new facility.
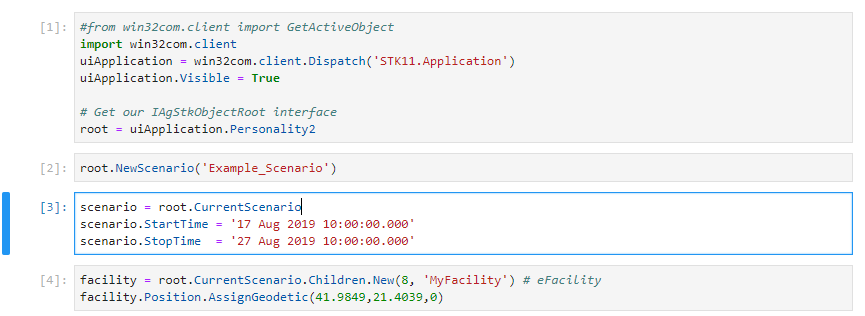 Organizing code in cells with Jupyter notebook
When a specific portion of the code has to be changed, you only need to run that part instead of running the script from the beginning, and this represents a great way to test/explore/analyze scenarios in different configurations.
A great advantage of the Jupyter notebook environment is the capability to interactively display the results gathered from STK in the form of tables (using the Pandas module) or graph (using the Matplotlib module), as you can see from the two pictures below:
AGI provides some useful Python code samples that are available here. I also linked to the full source code for the example discussed in this blog (note that Anaconda is not required – you can use any Python IDE to run the code).
Happy coding!
Giuseppe
Author

Integration
Automate Systems Tool Kit (STK) and integrate it with other applications to extend its capabilities.